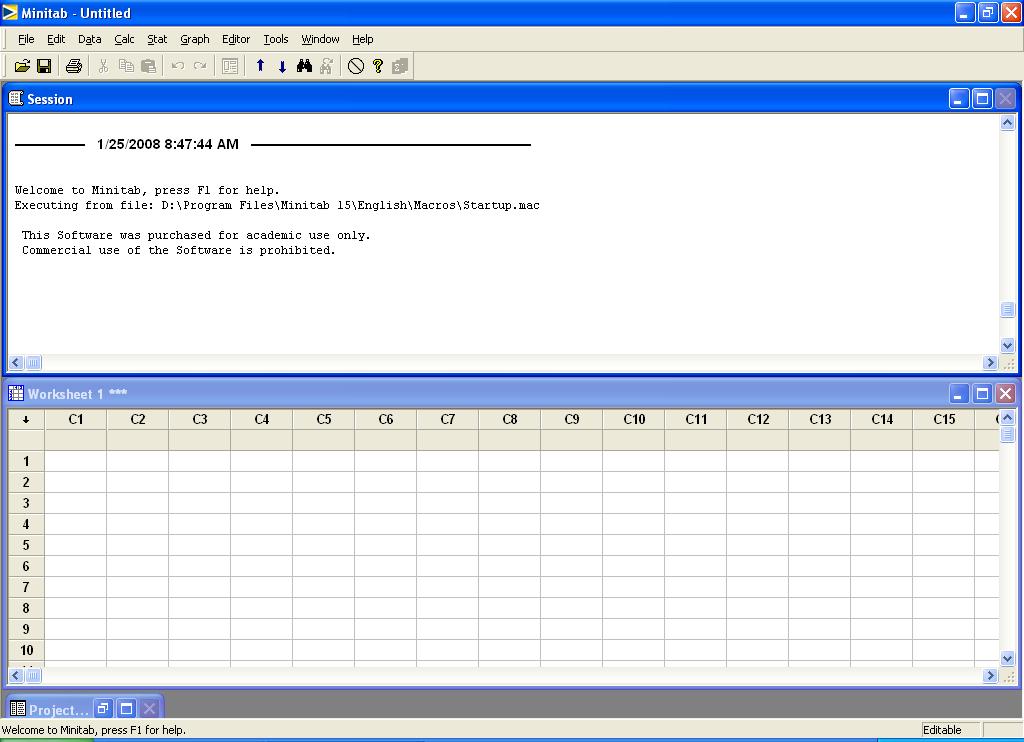
In this example we use:
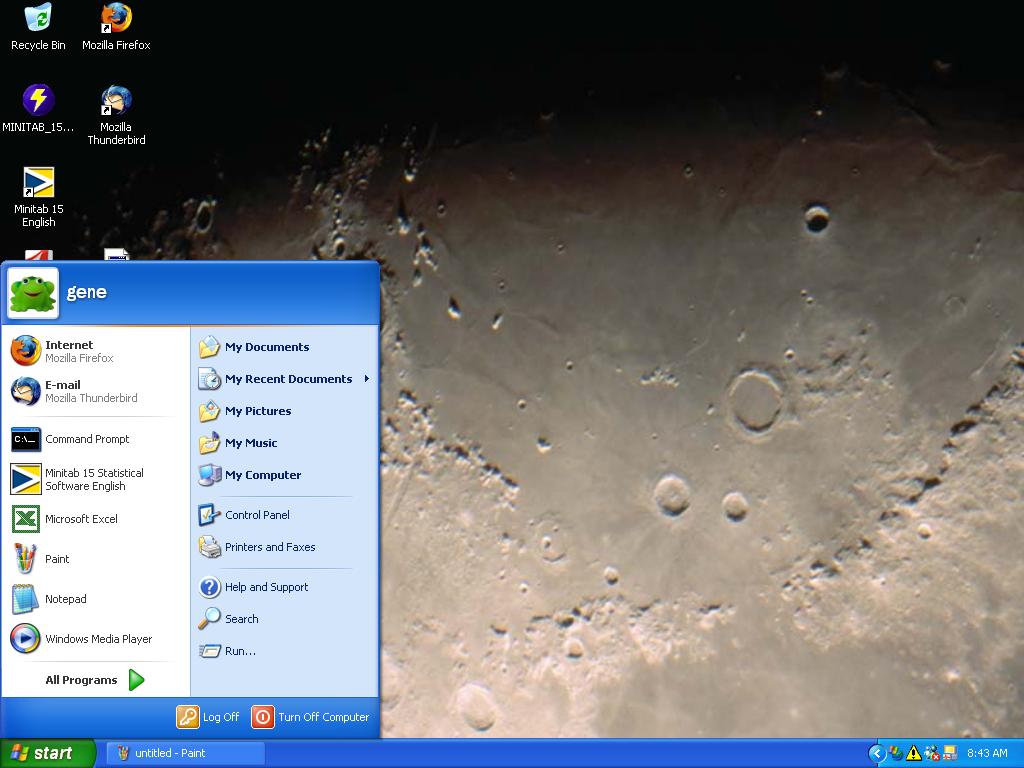
From the START button,
Select All Programs
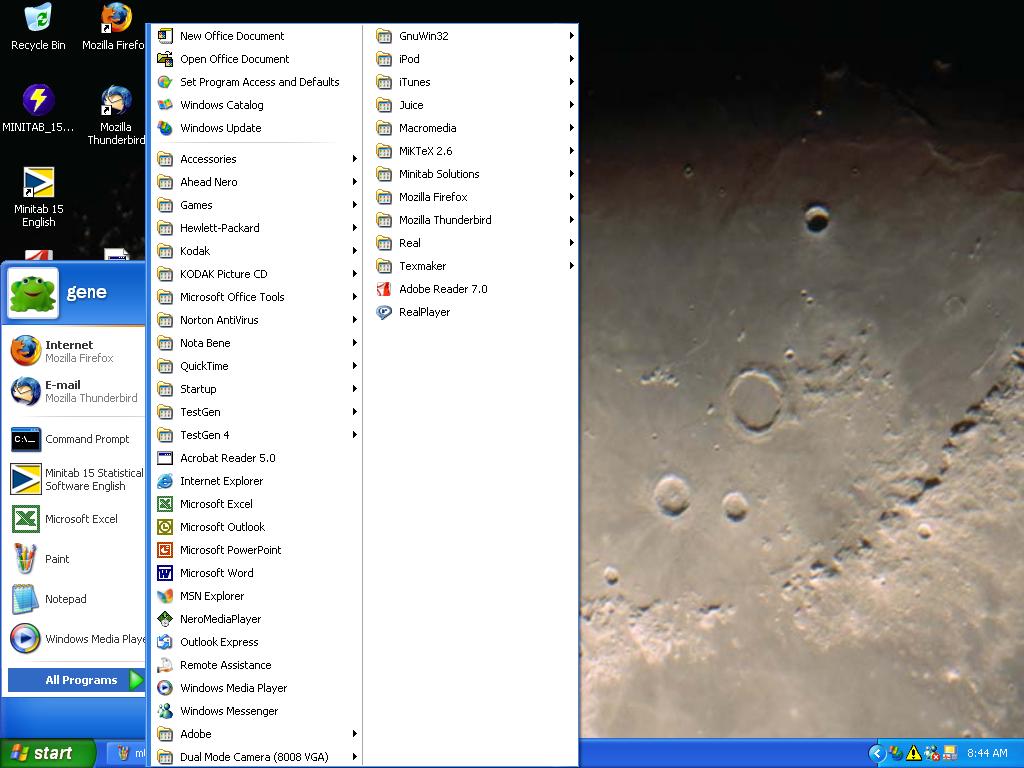
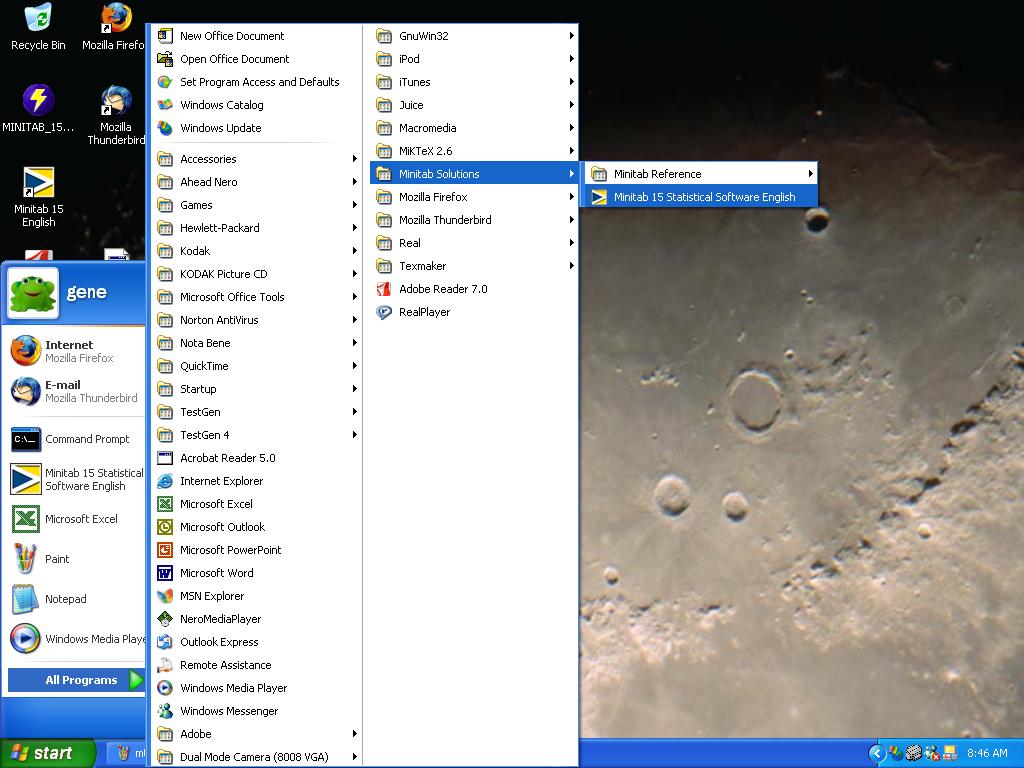
Select Minitab Solutions subentry Minitab 15 Statistical Software English
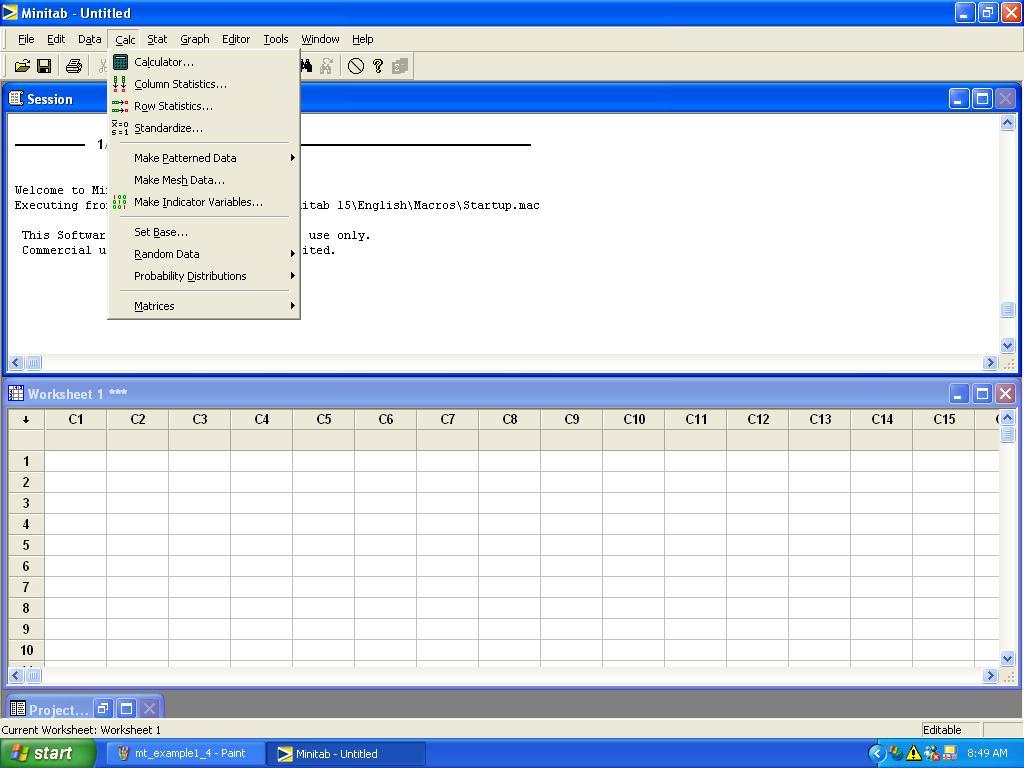
From the Calc pulldown menu at the top of the Minitab Window,
Select the Calc pulldown menu,
select the Random Data item and (in this example) the Normal.. subitem
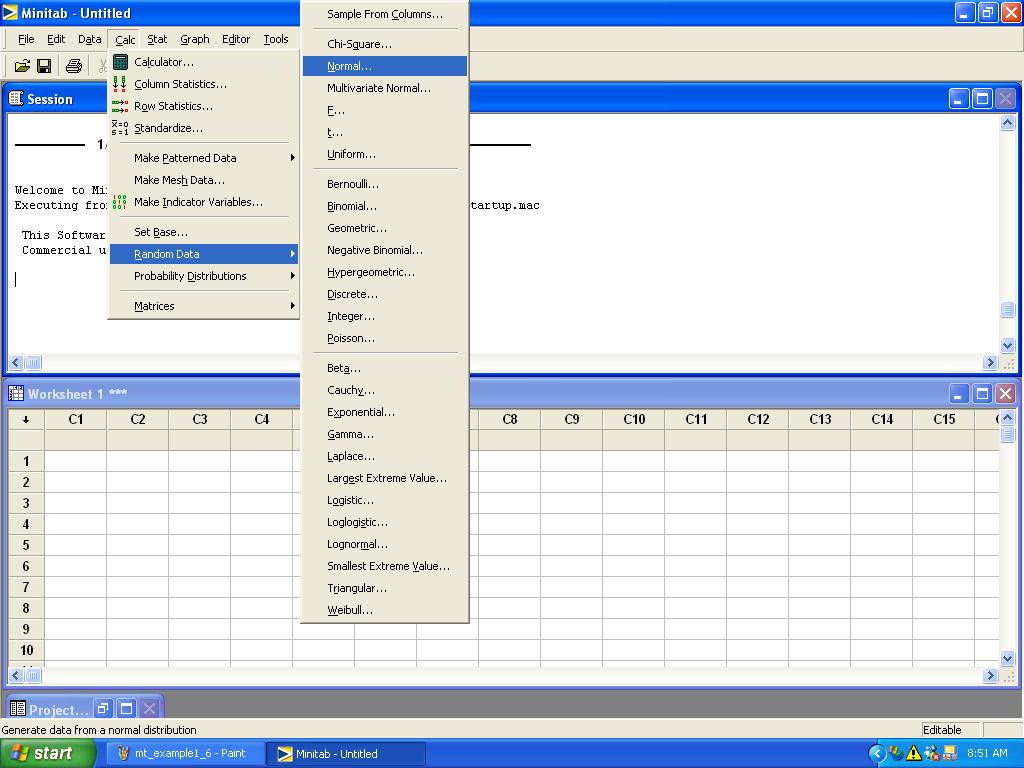
The following dialog box should appear:

In the Number of rows of data to generate: window, enter 100:
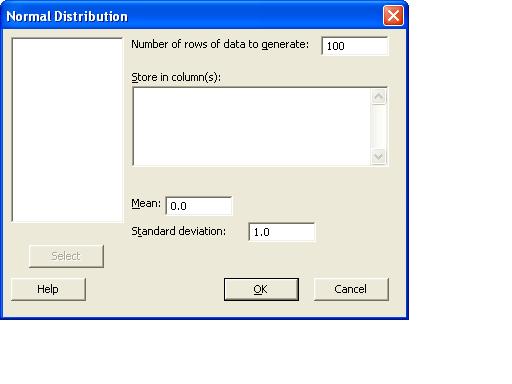
Next enter:

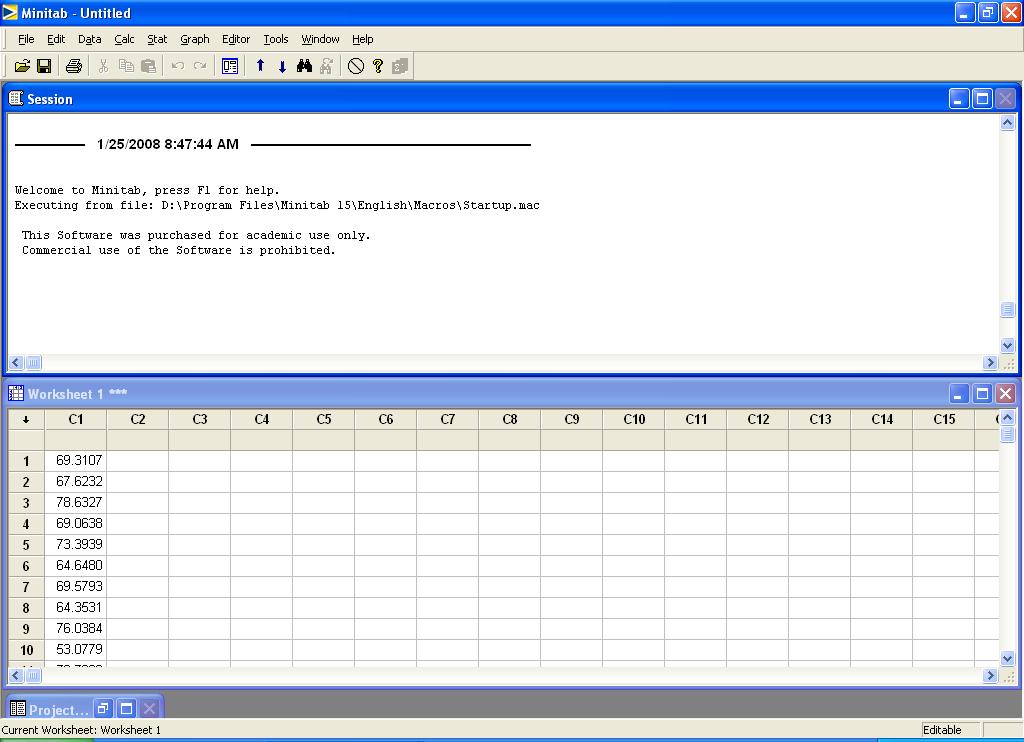
Now column c1 should be populated with 100 values:
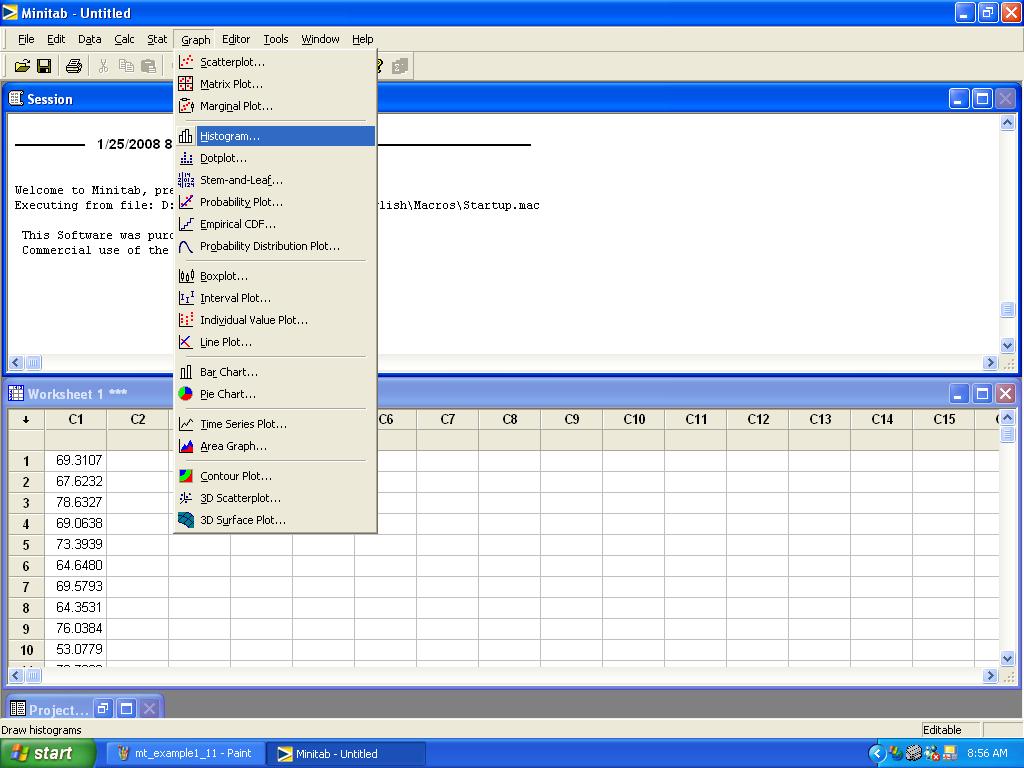
Now select the Histogram item from the Graph pulldown menu:
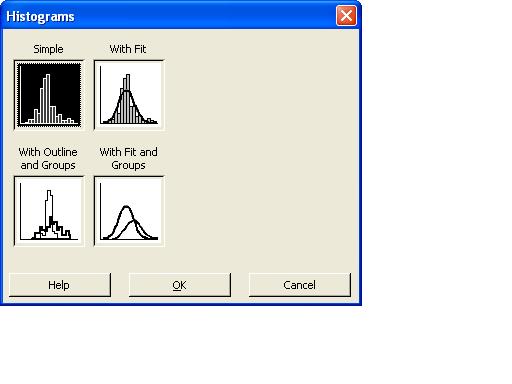
The following dialog box should appear, with Simple highlighted. Click the OK button.
The following dialog box should appear:

Highlight the column c1 and press the Select button:
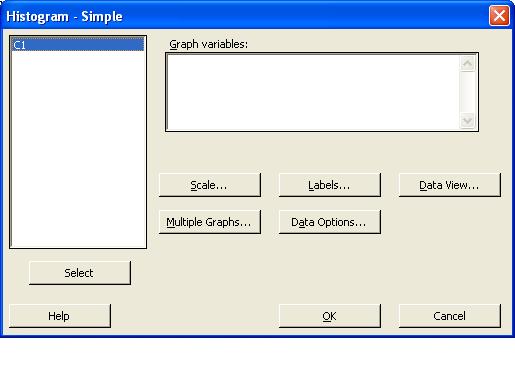
c1 should appear in the Graph variables: window. Click the OK button.

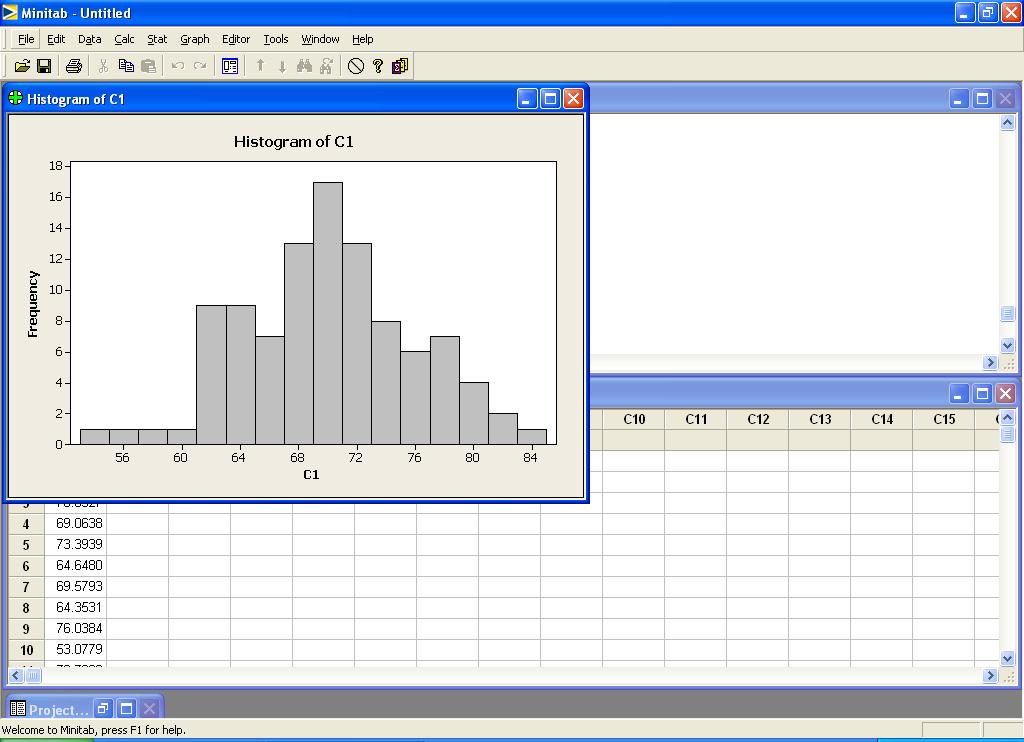
A new window containing the histogram should appear:
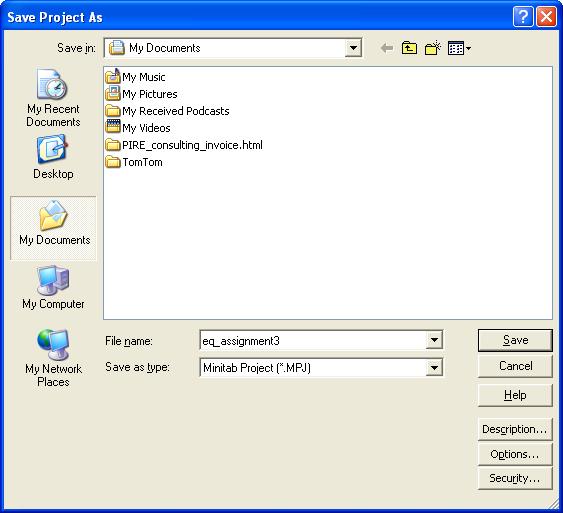
To save the Minitab project, pull down the File menu and select Save Project as
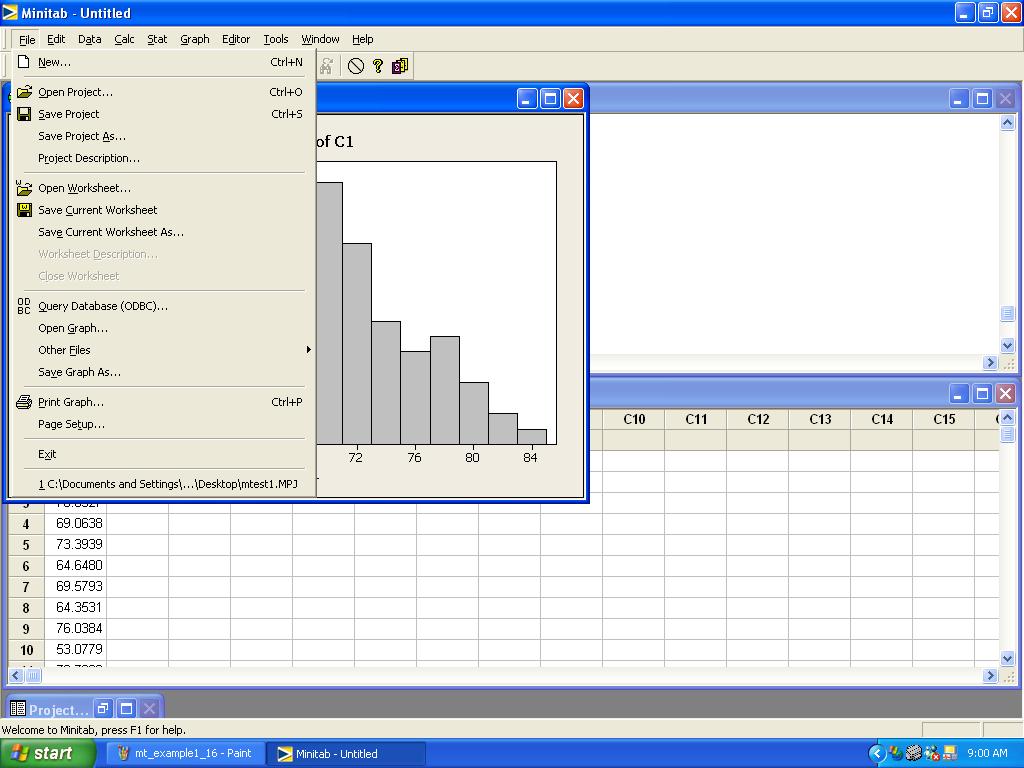
The following dialog box should appear:

Use the dialog box to select the folder in which to save the project, assign the project a name, and click Save