This assignment will make use of the same data file used in Assignment 1. You may use either the .csv or the .xls version.
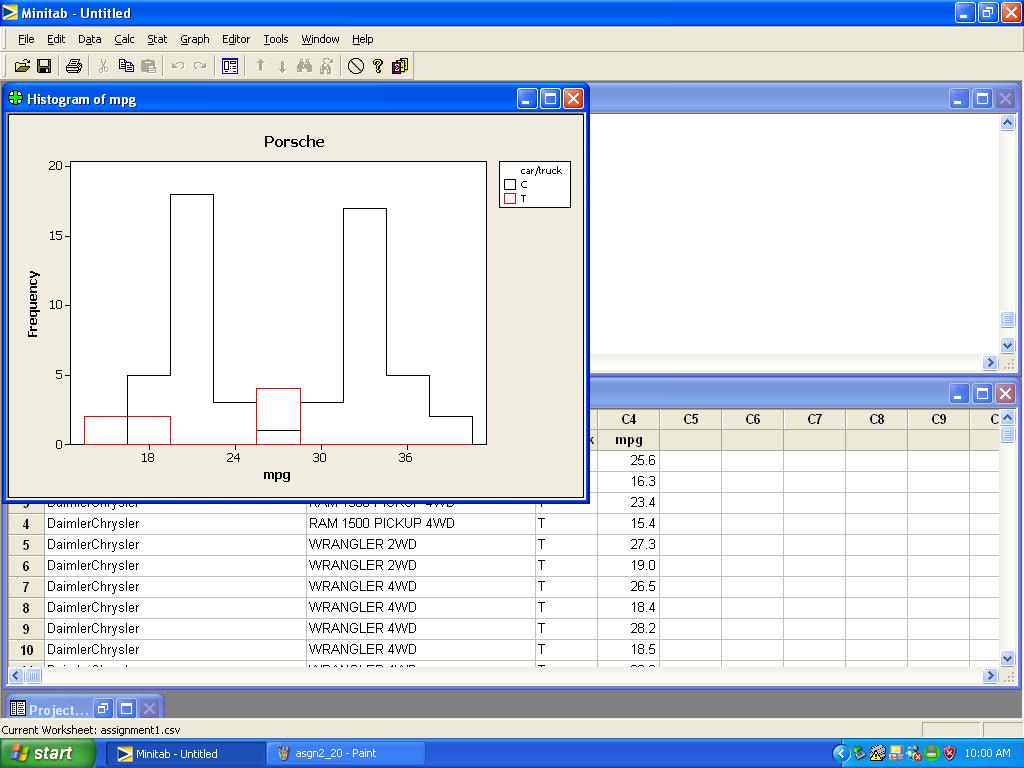
In this exercise, suppose a car manufacturer claims to have more vehicles rated at over 30mpg fuel efficiency than a competitor. Using the EPA data, it may be possible to tell at a glance whether this claim might be true or not. If we produced histograms showing the mpg for the models of both manufacturers, it might reveal that the claim is plausible.
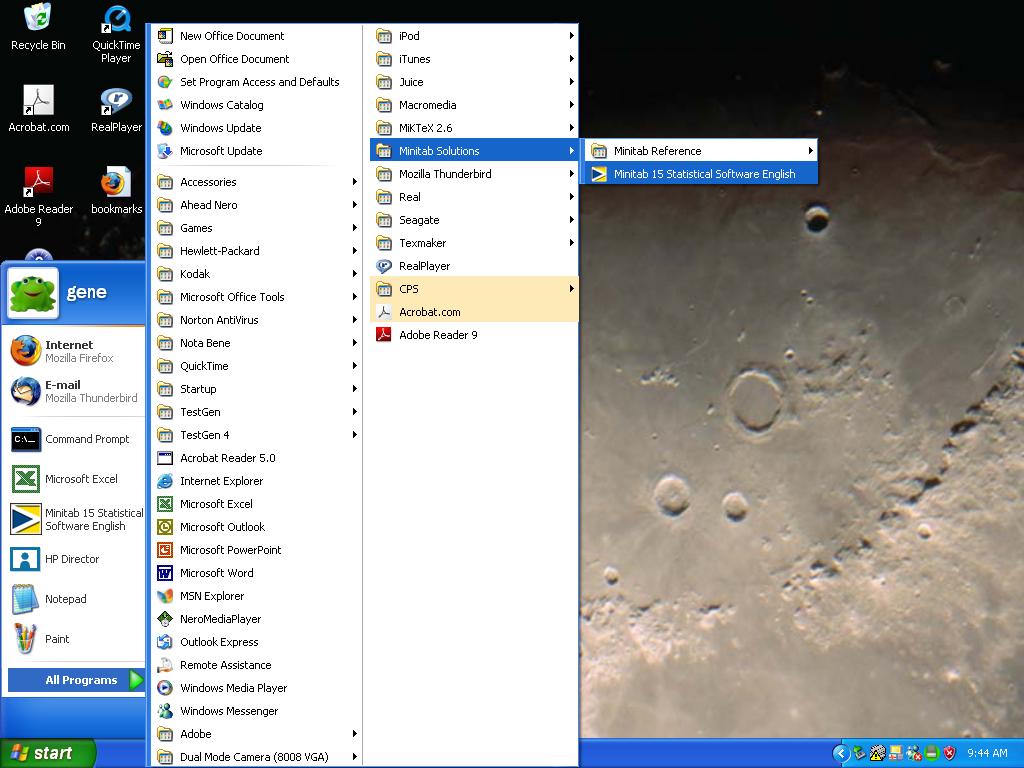
First start MINITAB. You should be able to find it under the All Programs button.
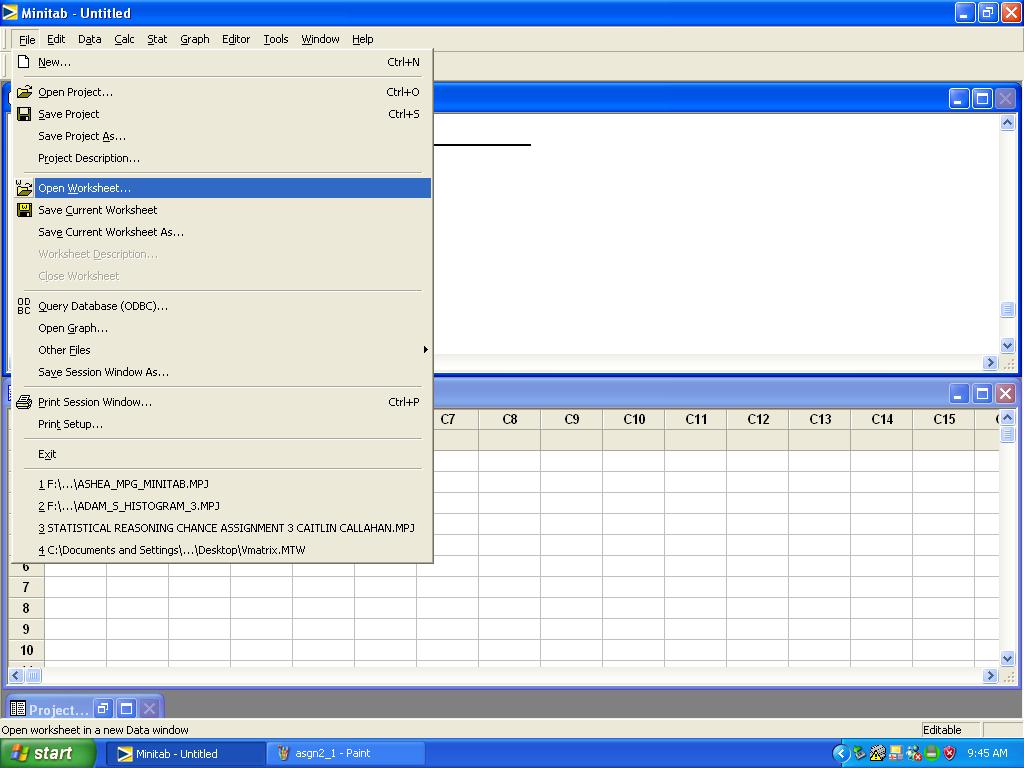
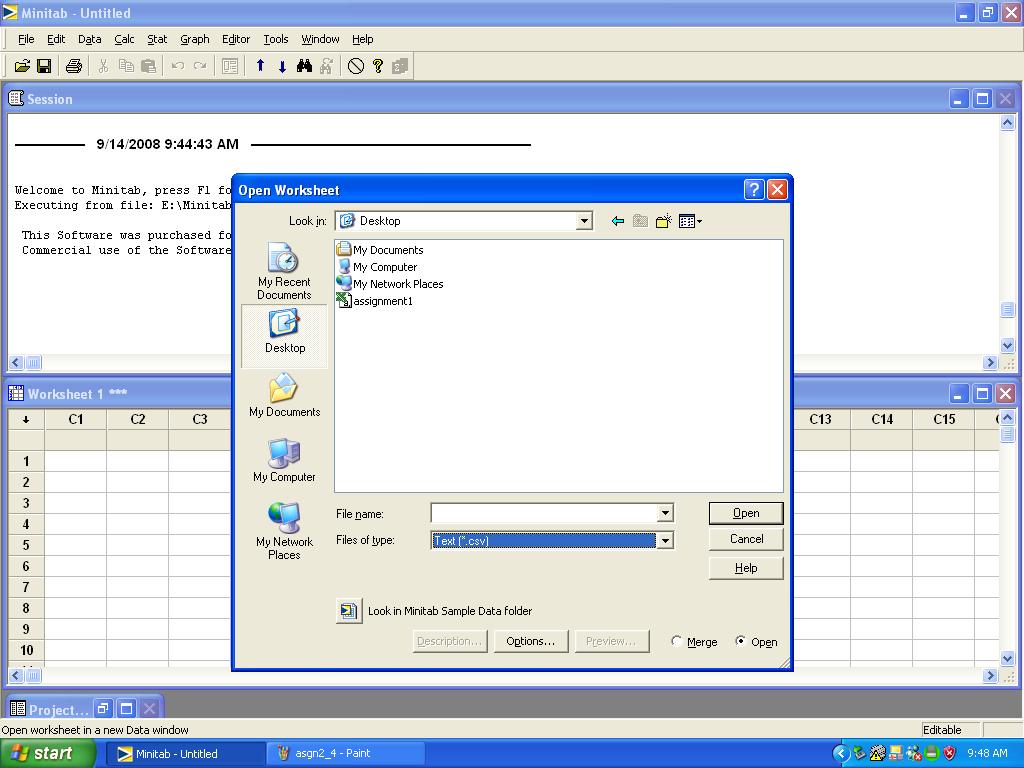
When MINITAB starts, pull down the File menu and select Open Worksheet
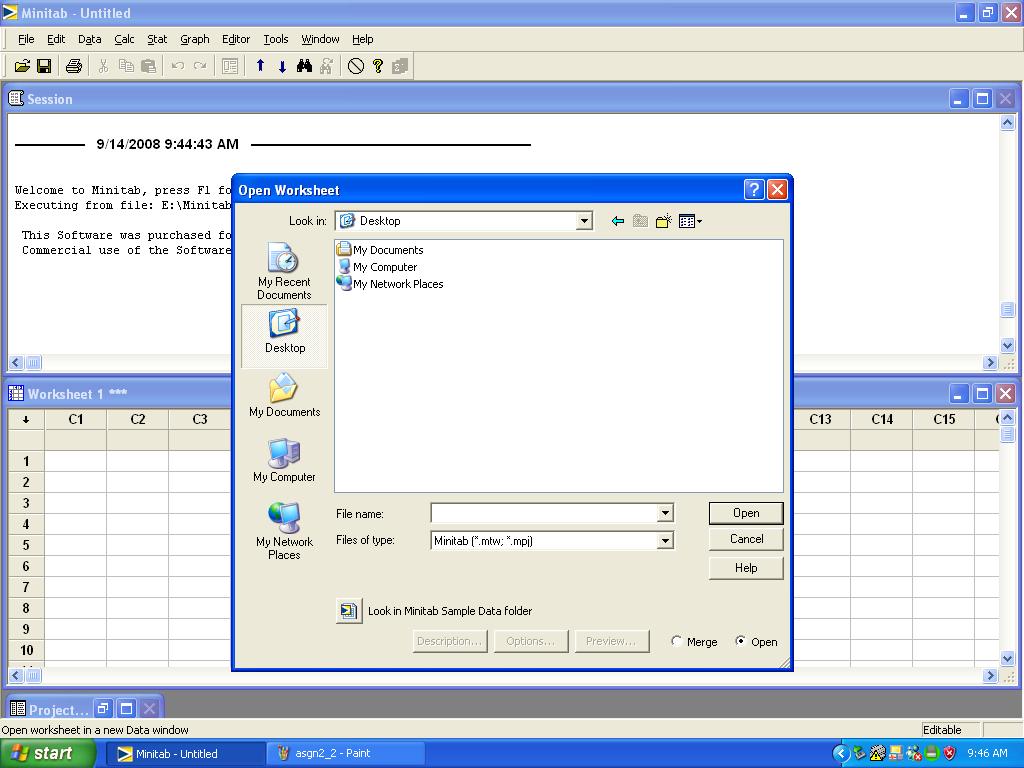
The following dialog box should appear. It will probably not show your .csv or .xls file initially, because it defaults to only show MINITAB files.
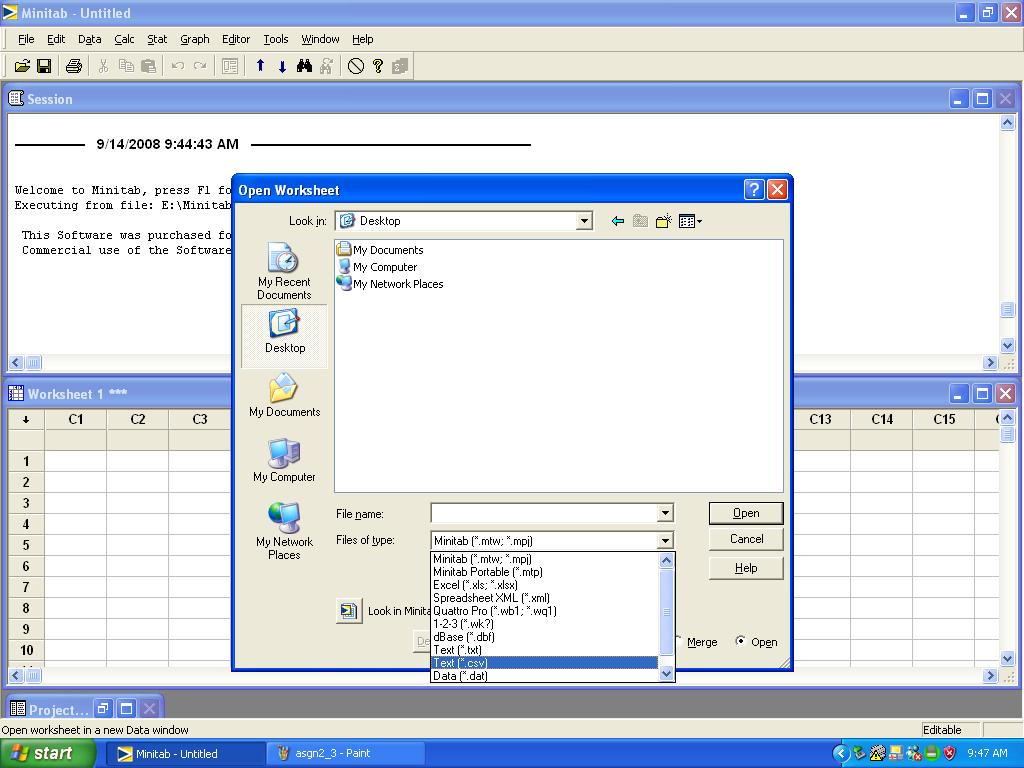
Click on the arrow to the right of the Files of type: box and select Text(*.csv) or Excel(*.xls,*.xlsx), whichever you have. (Unless MINITAB has been recently updated, it may not show *.xlsx)
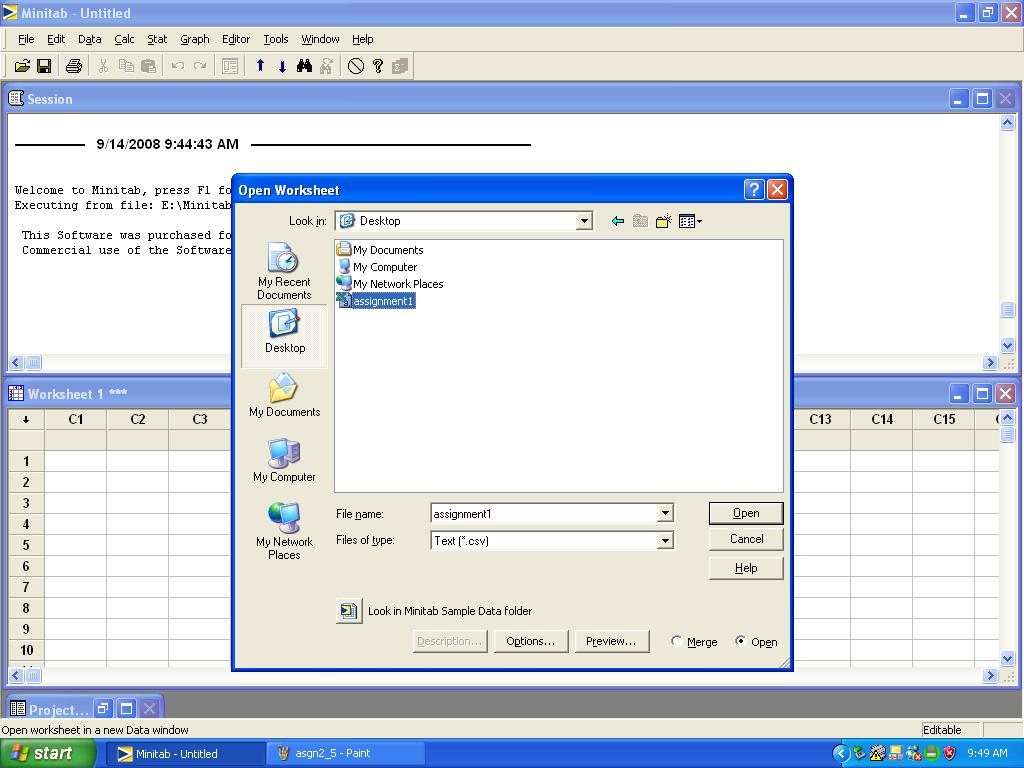
Now the file you downloaded should appear in the dialog box.
Highlight your file, and click Open
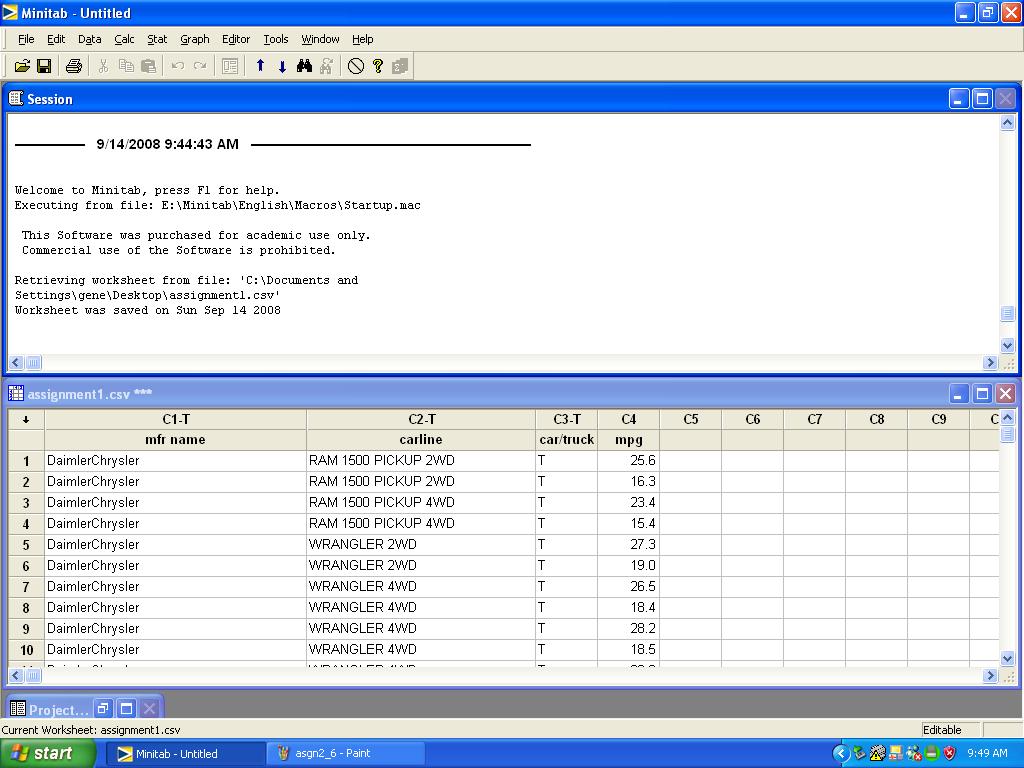
The data should now appear in four columns in MINITAB.
From the Graph menu, select Histogram
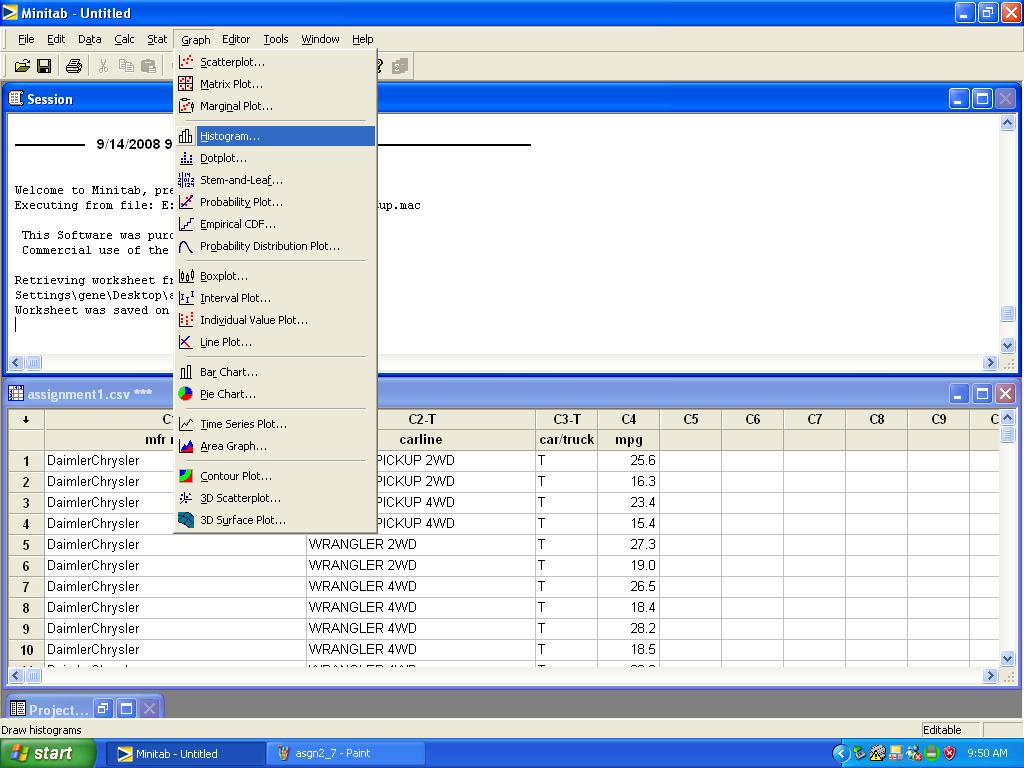
The following dialog box should appear:
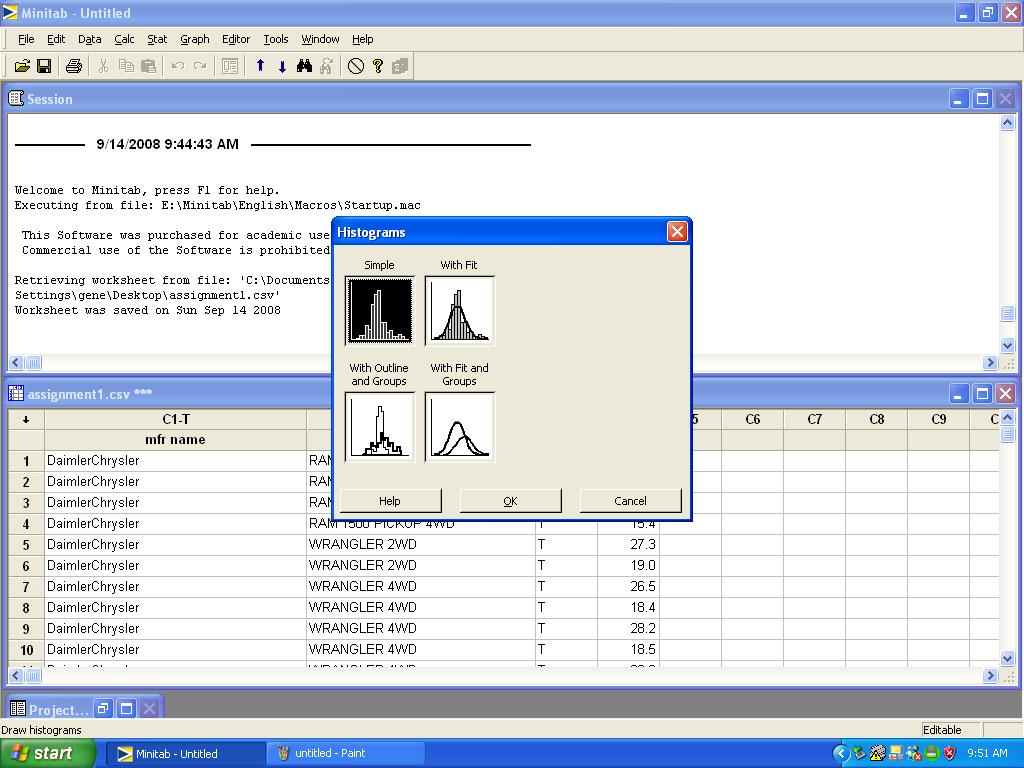
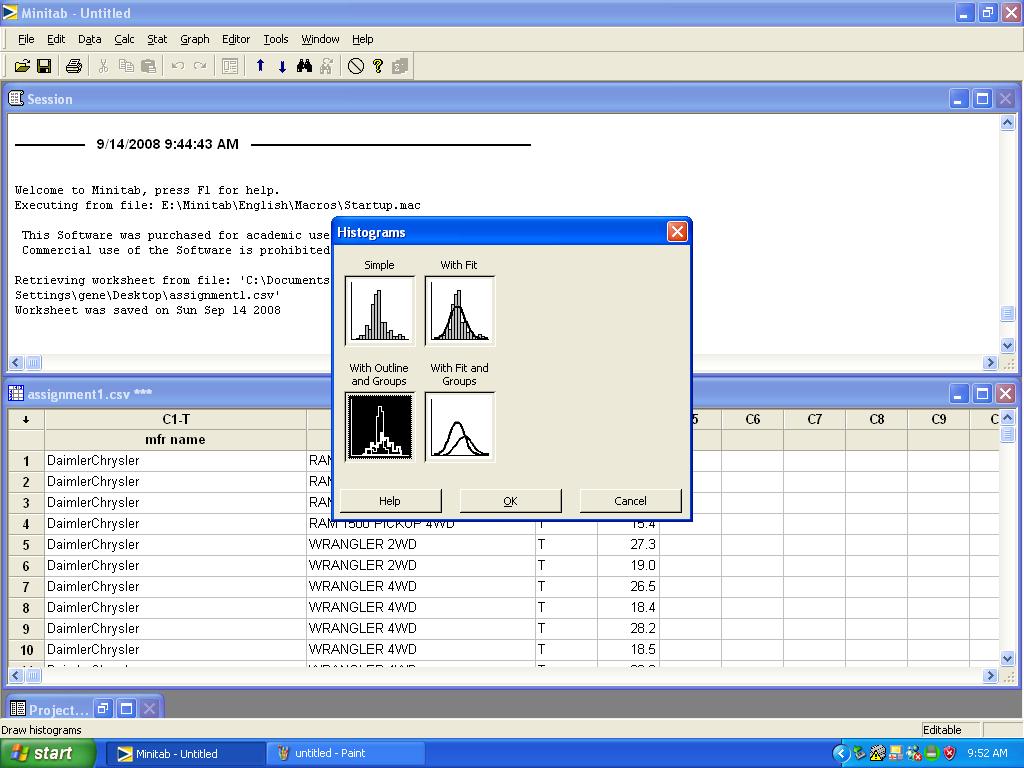
Since we want to graph cars and trucks separately, select With Outline and Groups
The following dialog box should appear:
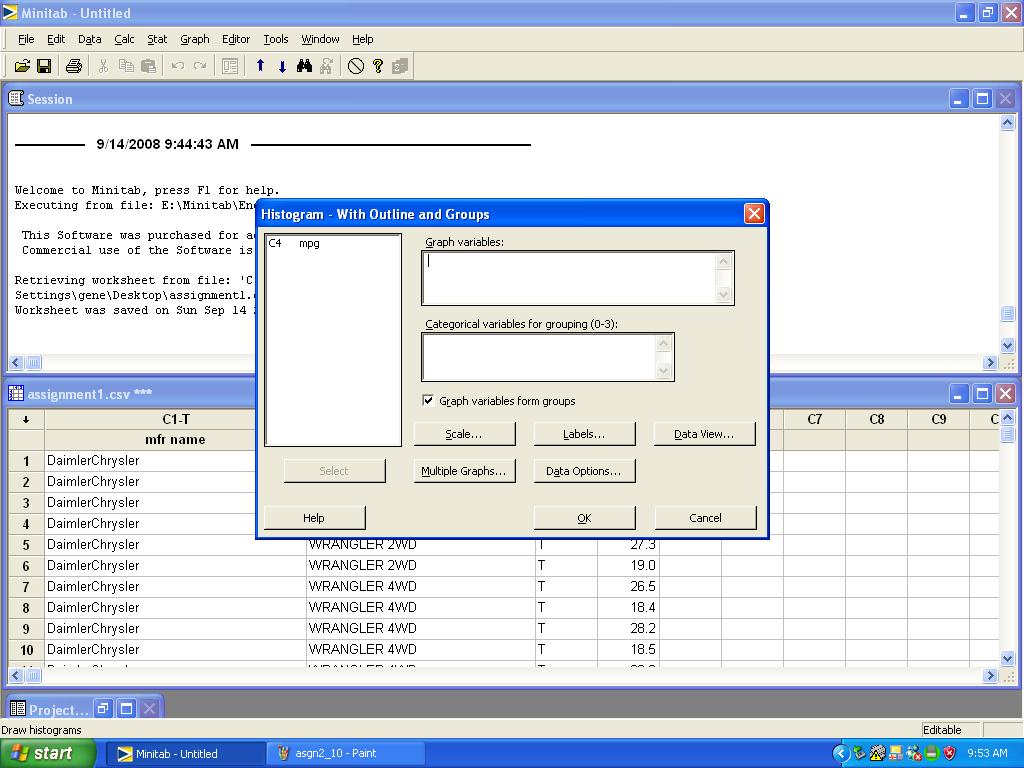
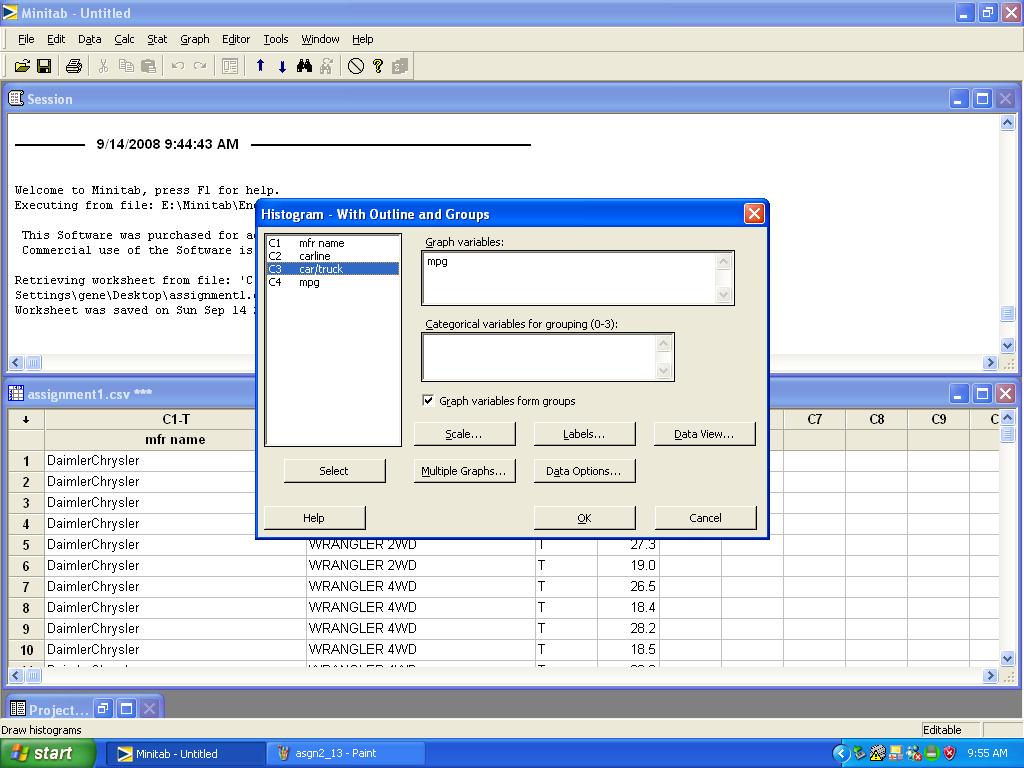
First select the Graph variable by positioning the cursor in the Graph variables: box. MINITAB should show a list of columns it thinks contain numerical data in the box above the Select button. Highlight C4 mpg and click Select.
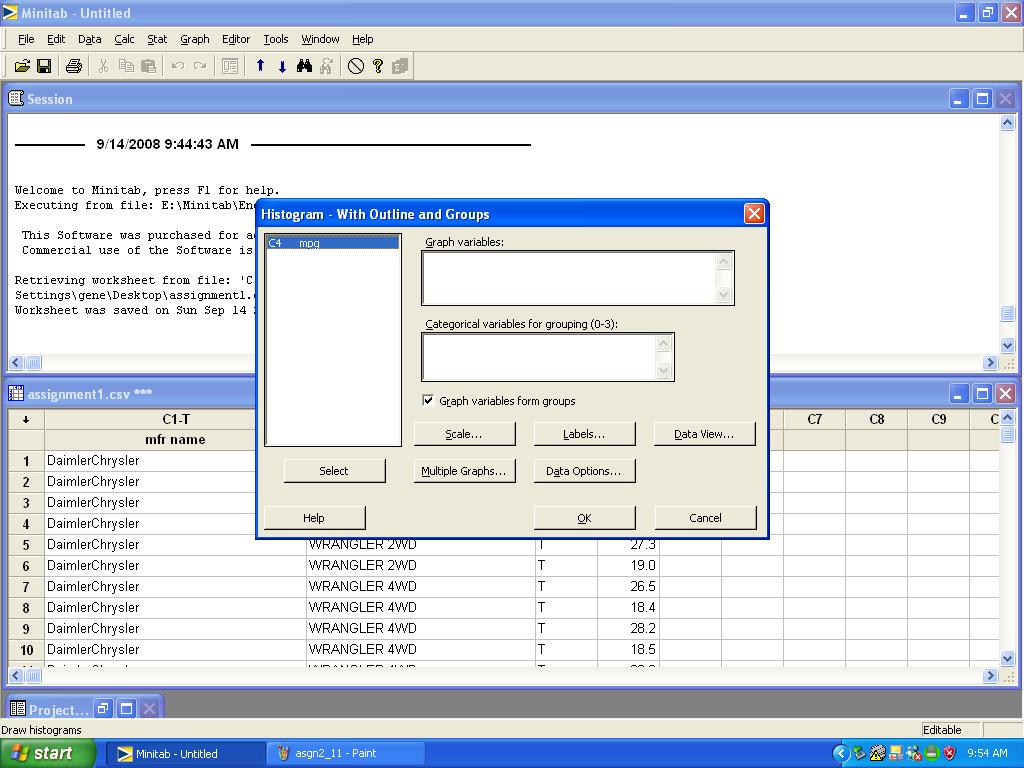
Now the mpg variable should appear in the
Highlight C3 car/truck and press Select
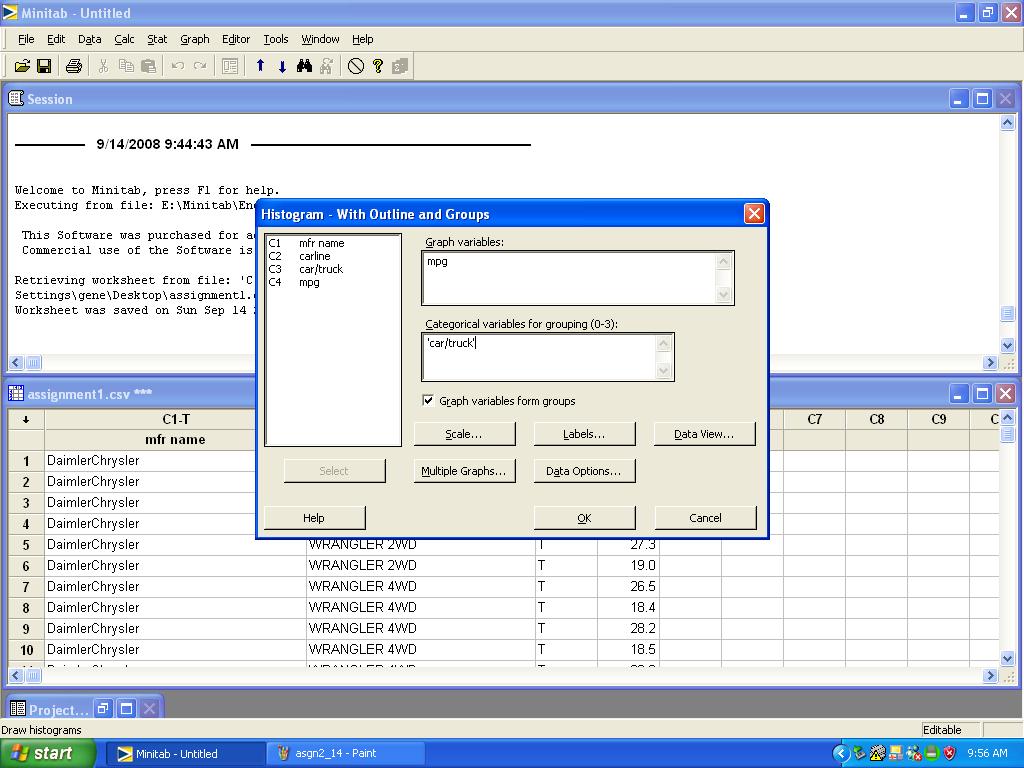
'car/truck' should now appear in the Categorical variables for grouping(0-3) box:
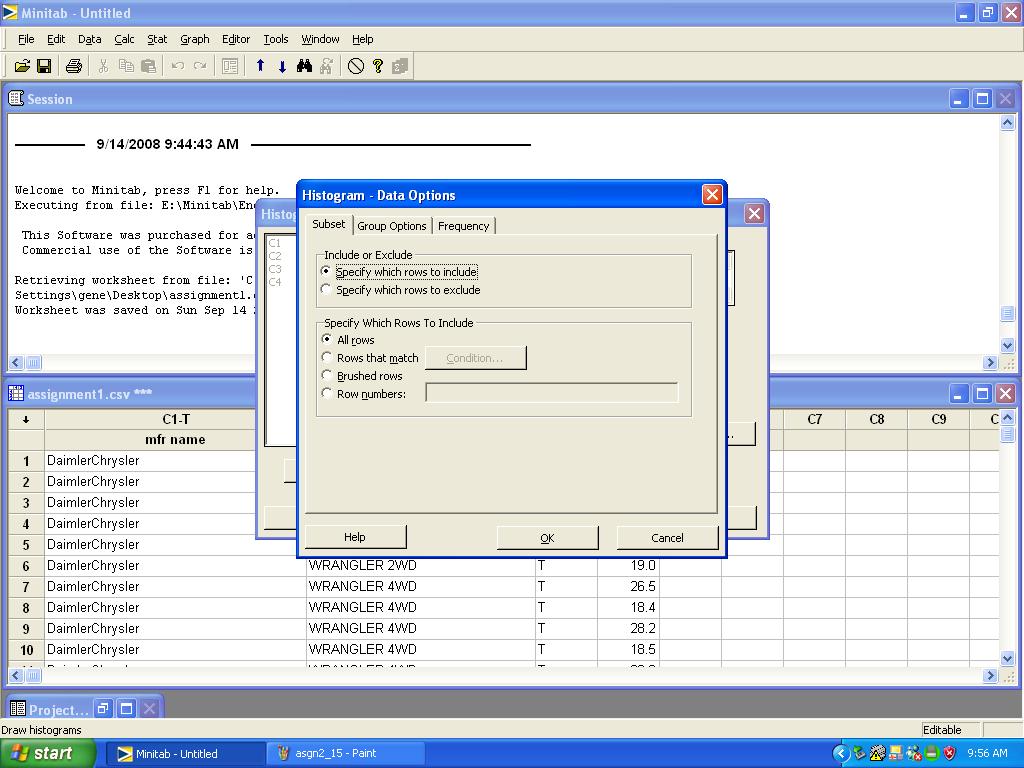
Click the Data Options button to get the following dialog box:
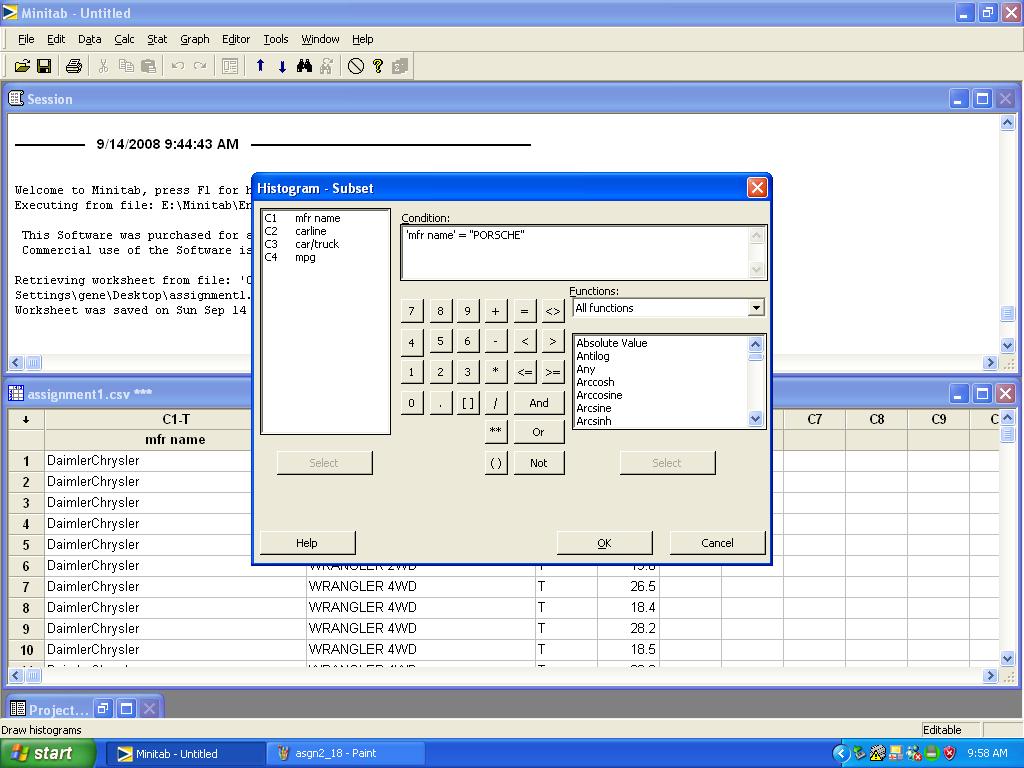
Click Rows that match and Condition to get the following dialog:
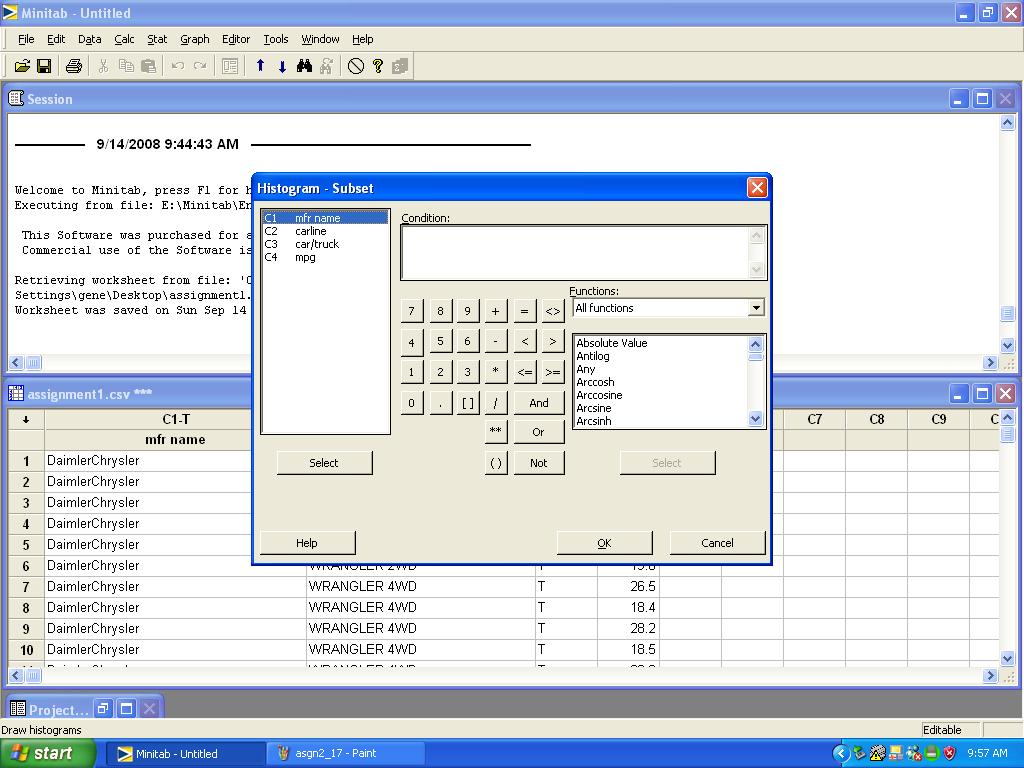
Highlight C1 mfr name and press Select
'mfr name' should appear in the Condition: box. Either type "=" after it, or click the = button on the keypad, then type "PORSCHE" (don't forget the double quotes) and click OK.
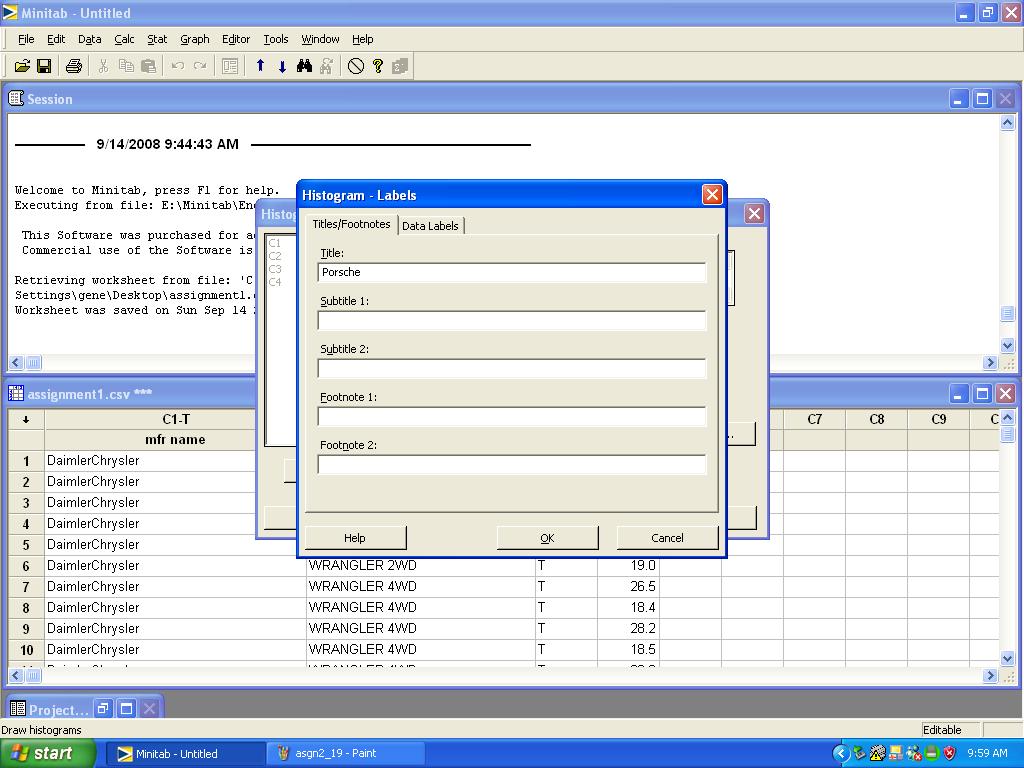
Next add a title to the histogram by clicking the Labels button. The following dialog should pop up:
Type the word Porsche in the Title box and click OK, then click OK again to produce the histogram:
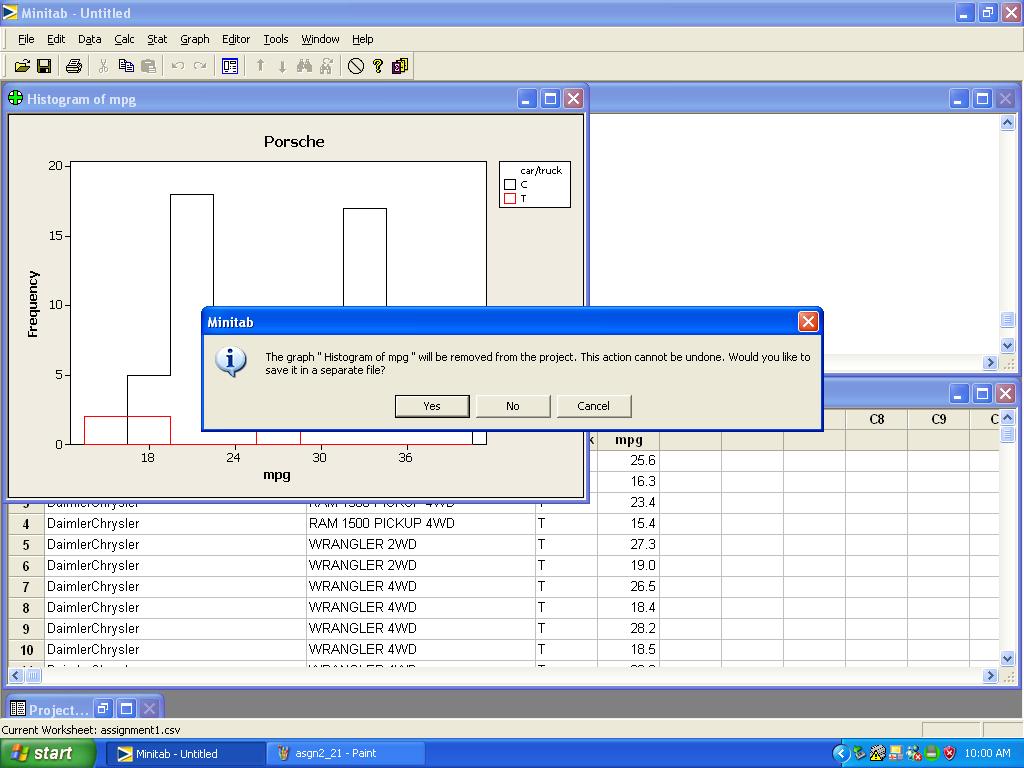
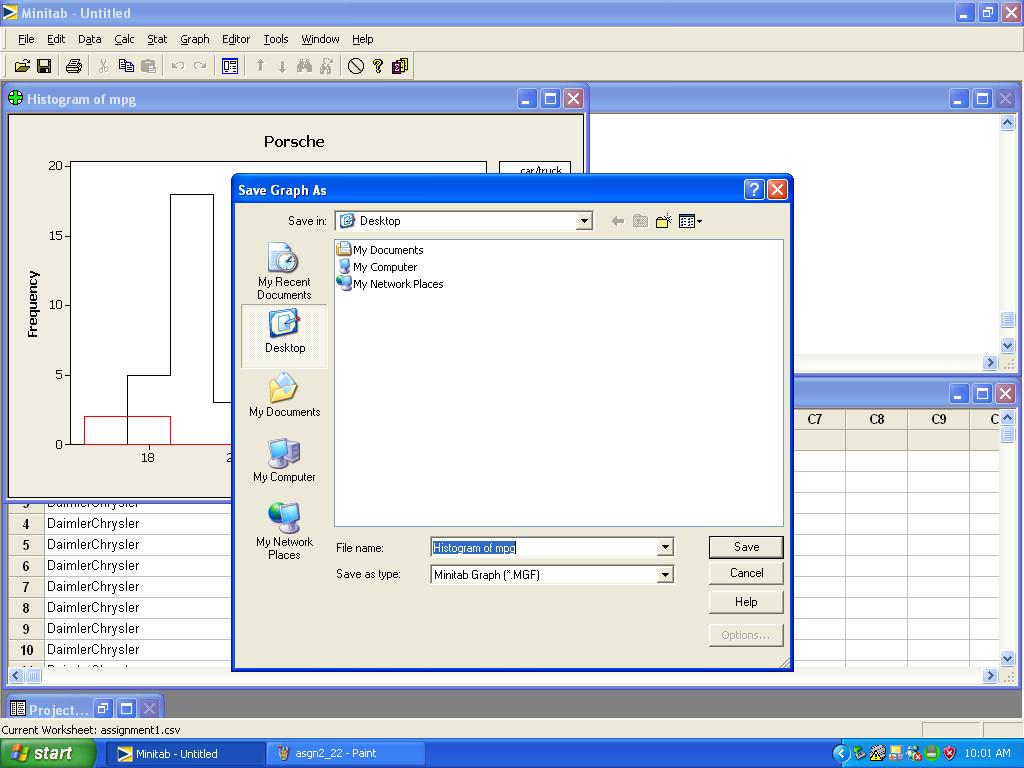
If the histogram is correct and you want to save it as a JPEG, click on the rec X in the upper left corner of the window. This will pop up a dialog asking if you want to save the histogram in a separate file:
Click Yes and the following dialog should appear:
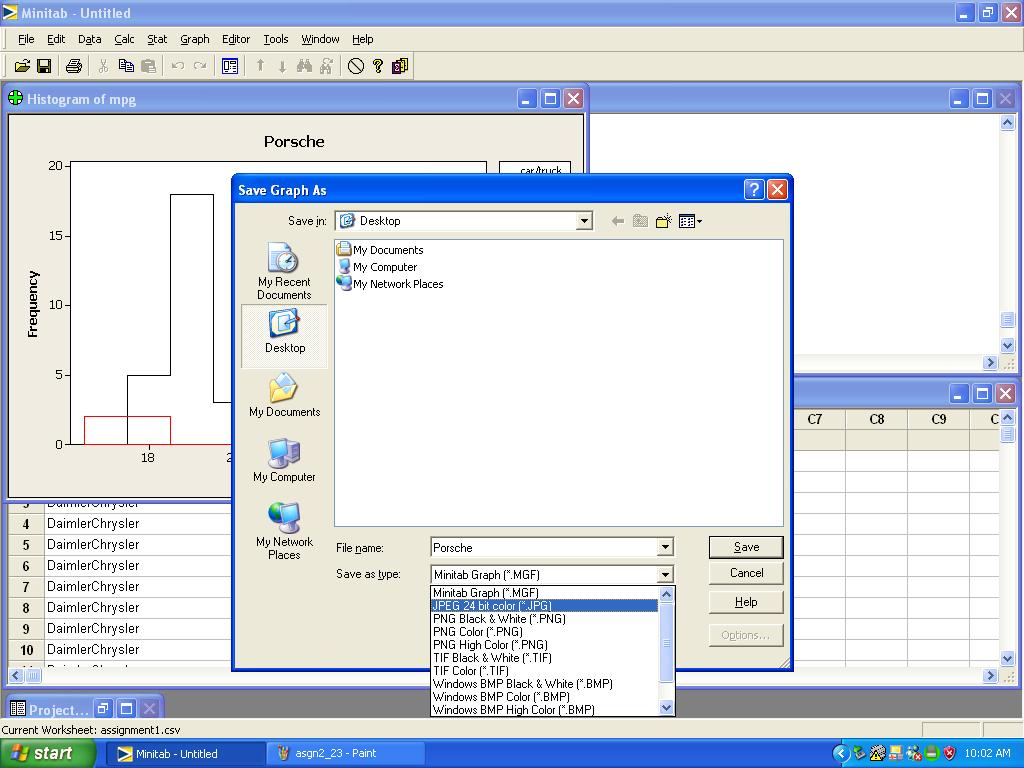
The default is a MINITAB format, .MGF, but we want a standard image format like JPEG, so click on the arrow to the right of the Save as type: box to get more choices:
Select JPEG 24 bit color (*.JPG), and change the name of the file to something that reflects the manuracturer's name. Then, click Save to save the histogram as a JPEG image (.JPG). You should be able to attach this file to an email for submission.
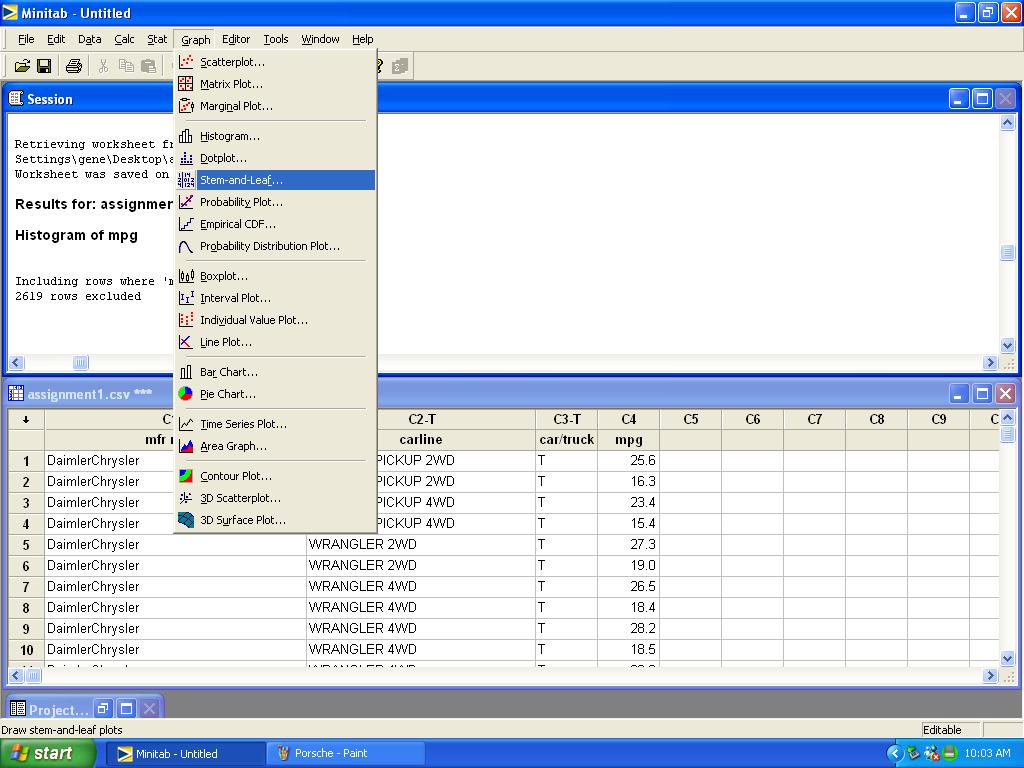
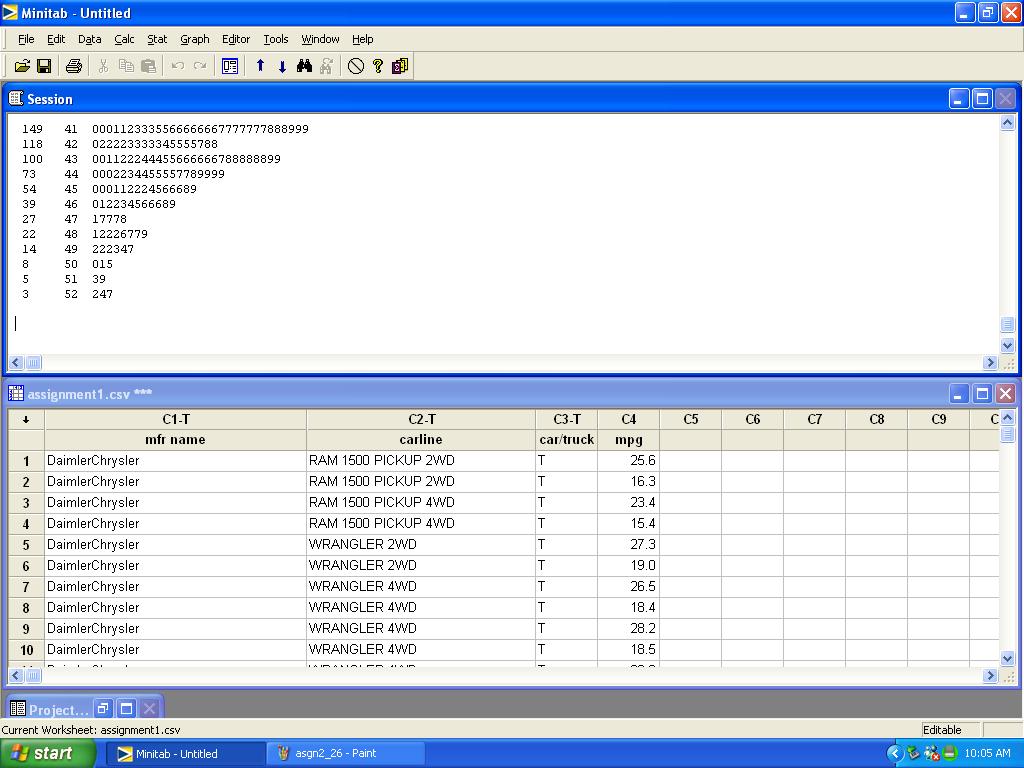
Finally, we want to produce a stem-and-leaf plot of the entire mpg column. Select Stem-and-Leaf from the Graph menu
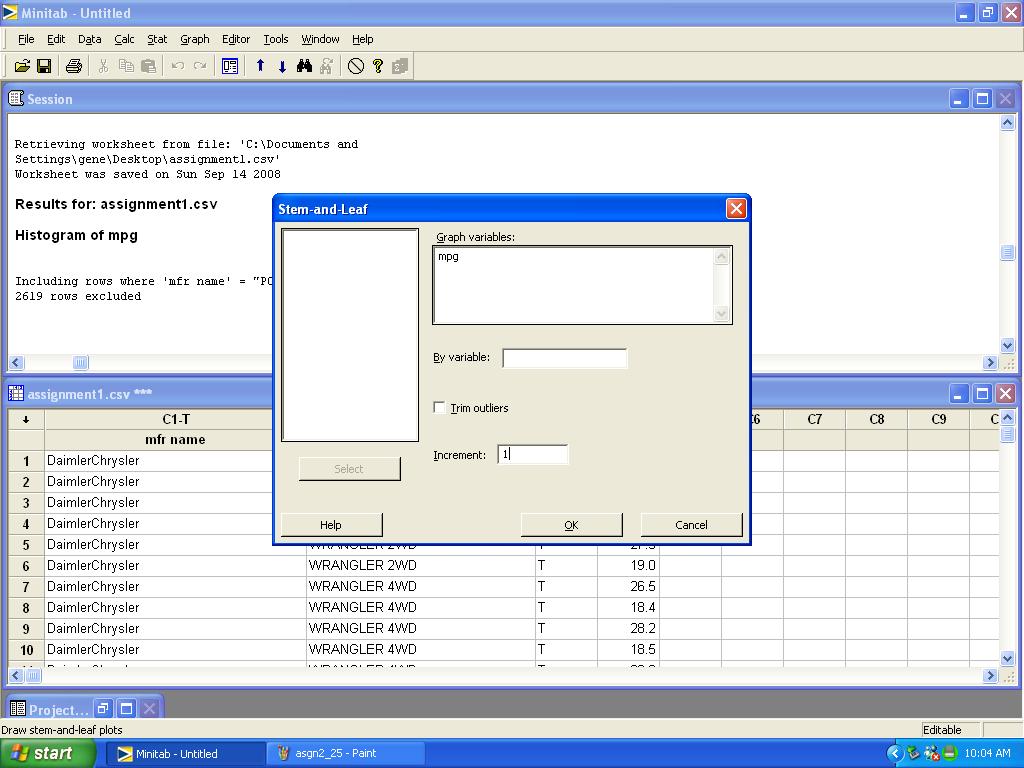
The following dialog should appear. As before select C4 mpg in the Graph variables: box, and type 1 in the Increment: box.
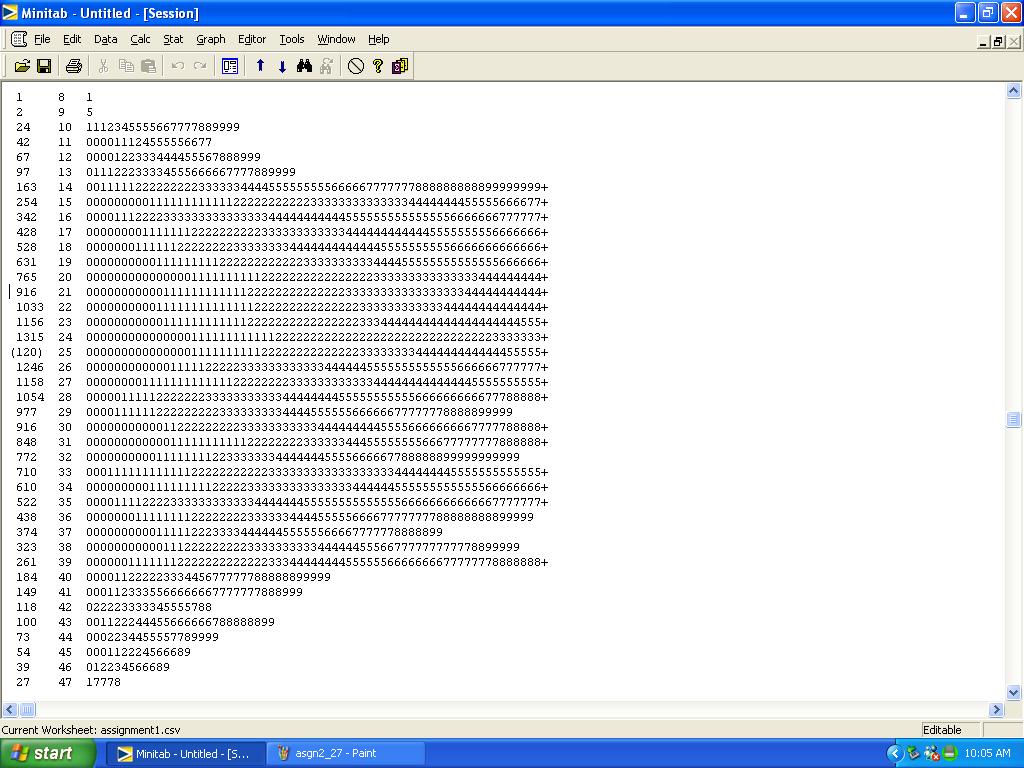
Then click OK and the stem-and-leaf plot should appear in one of the MINITAB windows.
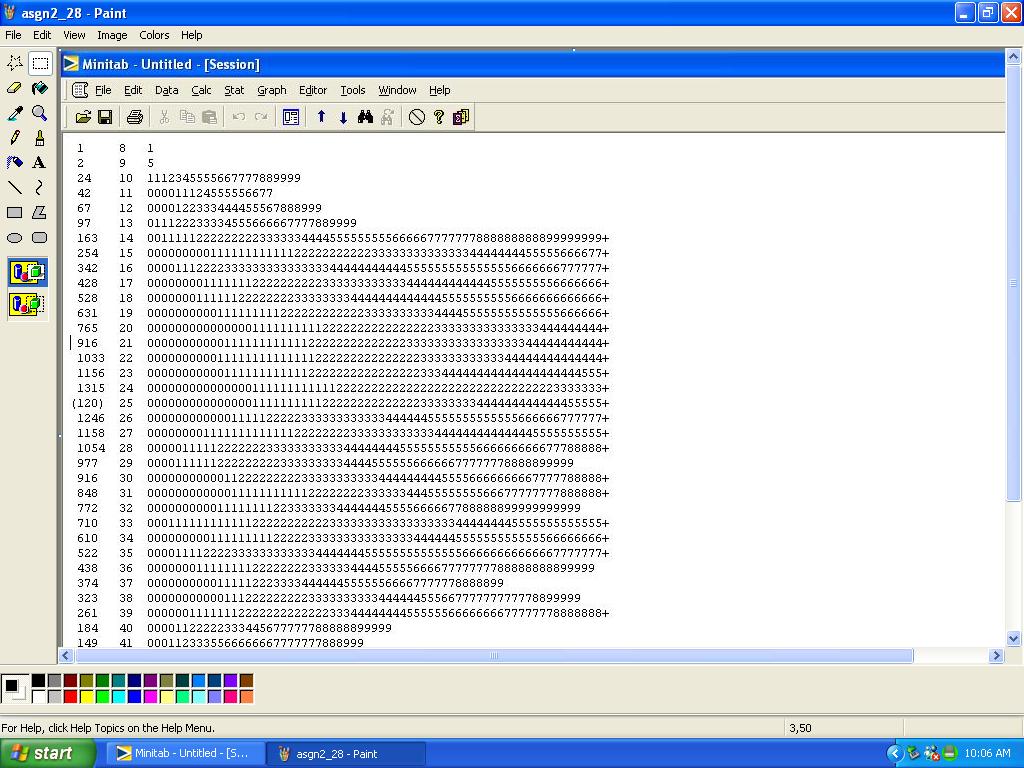
One way to save this is to maximize the window and take a screen snapshot. Click on the square in the upper left hand corner to maximize the window, and then press the PrtSc key. This will paste an image of the screen into the clipboard.
Start the Paint program, which usually appears under Accessories in the program menu, and when it opens, place the cursor in the (empty) space where the image would normally be, right click, and select Paste. An image of the screen should appear in the image box.
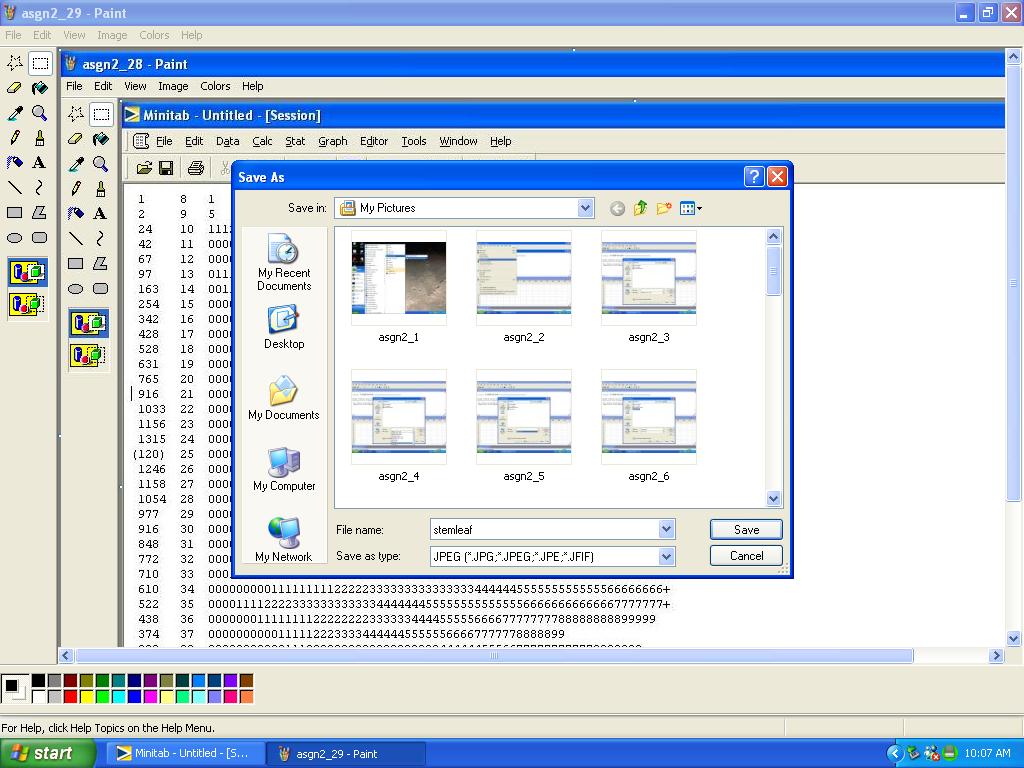
Pull down the File menu and click Save As. As before, modify the destination folder, the Filename,
and Save as type to create a JPEG file with a meaningful name in the folder you want it to go in. As before, you should be able to paste the JPEG into an email for submission.